While Audit Logs track user actions, System Logs show safe operational events from the platform runtime, edge gateways, rules, and integrations.
System Logs are designed for daily operations. They help administrators see what happened, which area was affected, and whether the same event is repeating without exposing internal stack traces, file paths, connection strings, tokens, or raw payloads in the UI.
Accessing Logs
Navigate to Administration > System Logs.
Log Structure
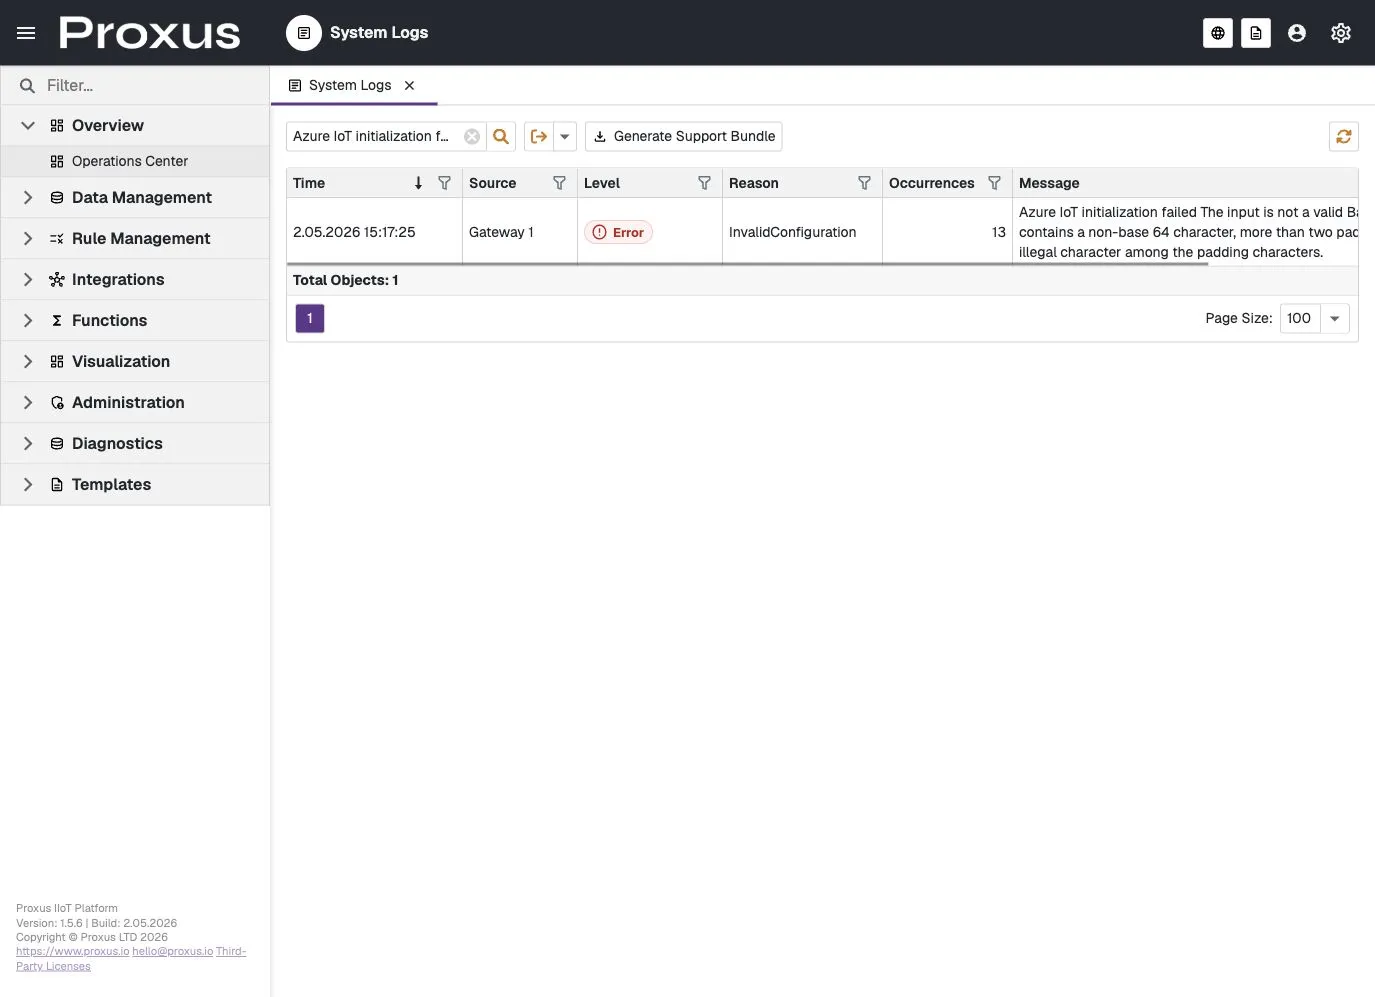
The log viewer provides a filterable grid with the following columns:
- Time: Event time shown in the active user culture and deployment time zone.
- Source: The platform area that emitted the event, such as
PlatformorGateway 1. - Level: Severity of the event.
- Reason: A stable reason category such as
InvalidConfiguration,ConnectionFailed,Timeout, orDependencyFailure. - Occurrences: How many times the same fingerprinted event occurred in the selected log window.
- Message: A safe operational summary. It is written for administrators and support triage, not as a raw stack trace dump.
The System Logs screen does not show stack traces, absolute file paths, secrets, authorization tokens, connection strings, or raw telemetry payloads by default. Detailed diagnostic evidence is kept in local file logs and can be packaged through a support bundle when needed.
Support Bundle
When a customer or support engineer needs deeper evidence, use Generate Support Bundle from the System Logs toolbar. The bundle collects the selected operational context together with sanitized file-log details that are not shown in the grid.
A support bundle is useful when:
- an integration is failing but the UI only shows a safe summary
- a gateway or device repeatedly reports the same error
- support needs timestamps, repeated occurrence counts, build/version context, and diagnostic excerpts
- you want to share evidence without exposing secrets or raw payloads
When opening a support ticket, include the time range, affected gateway/device/connector if known, the visible Reason value, and the generated support bundle.
Diagnostic-Only Events
Some highly technical events, such as MCP audit/debug transport entries, are diagnostic-only. They are kept out of the operational System Logs screen to reduce noise for administrators. If those details are needed, generate a support bundle or inspect the local file logs according to your support procedure.
Log Levels
Proxus uses standard logging levels to categorize events:
| Level | Description |
|---|---|
| Critical | Fatal failures that require immediate attention. |
| Error | Runtime errors that need investigation but do not necessarily stop the whole system. |
| Warning | Potential issues, degraded behavior, or configuration risks. |
| Information | Normal lifecycle events such as startup, shutdown, or configuration changes. |
| Debug | Detailed diagnostic information, normally kept out of the customer-facing operational view unless explicitly enabled. |
Configuration
System logging behavior is controlled via the central Proxus-config.toml file. See the Configuration File Reference for full details.
[Logging]
# 0:Trace, 1:Debug, 2:Information, 3:Warning, 4:Error, 5:Critical
Loglevel = 3

# Days to keep operational logs before auto-purging
LogRetentionTime = 14

# Enable detailed local file logs for support bundles
LogToFile = trueProxus keeps hot-path logging lightweight. Repeating failures are grouped with occurrence counts instead of flooding the operational log screen with the same message for every data packet.